
Texture Analysis Application Note: Hard Candy
Test Principle
Evaluation of the hardness and crunchiness of candy with texture analysis.
Background
Candy is produced by dissolving sugar in water or milk and heating the mixture until it reaches the desired thickness or consistency or begins to caramelise. The variety of candies available is determined by the ingredients utilised and the duration of boiling the syrup.
The ultimate texture of a candy is determined by the sugar concentration, which is influenced by the boiling temperature. Higher boiling temperatures lead to increased sugar concentrations as more water evaporates, resulting in hard and brittle candies. Conversely, lower boiling temperatures yield softer candies. Candy exhibits a range of textures, from soft and chewy to hard and brittle, such as jellybeans, fudge, toffee, candy canes, lollipops, and hard candy. Apart from boiling temperature, any alterations in the recipe can impact the candy's texture. Therefore, conducting regular texture testing on the candies is essential to maintain consistency across batches. Learn more about achieving the right food texture.
Utilising the texture analyser with the confectionery jig and cylinder probe allows for the assessment of the firmness, fracturability, and fracture quantity of hard candy. The durability of the device enables tests to be conducted seamlessly right from the production line to easily determine texture profiles.

Method
Equipment
- CTX Texture Analyser with 50kg load cell
- Fixture Base Table (TA-BT-KIT)
- Confectionery Jig (TA-CJ)
- 2mm Cylinder probe (TA-39) Texture Pro Software
Settings
- Test Type: Compression
- Pre-Test Speed: 1.0 mm/s
- Test Speed: 1.0 mm/s
- Post-Test Speed: 1.0 mm/s
- Target Type: Deformation
- Target Value: 15 mm
- Trigger Force: 15 g
Procedure
- Attach the 2mm cylindrical probe to the probe shaft of the load cell.
- Secure the Fixture Base Table to the base of the CTX Texture Analyser and fasten it in place using the side screws.
- Mount the confectionery jig onto the fixture base table and secure it using the thumbscrews.
- Position the sample in the confectionery jig, ensuring it is centrally aligned with the fixture's aperture, and tighten it in place with the four screws until the first resistance point is reached. Avoid over-tightening to prevent sample compression.
- Lower the probe to approximately 5mm above the confectionery jig.
- Align the confectionery jig's aperture with the probe above by adjusting the base table, ensuring the probe can penetrate the aperture smoothly without friction.
- Once alignment is achieved, secure the thumbscrews of the fixture base table to prevent further movement.
- Initiate the penetration test.
- Clean the cylinder probe and fixture after each test before proceeding to the next one.
Note:
In confectionery testing, precision and consistency are crucial. This method emphasises proper sample positioning and consistent test parameters. Starting with the hardest sample sets an accurate range, ensuring reliable comparisons across all samples.
For comparison purposes, samples should be placed into the confectionery jig in the same orientation.
Position the sample in the confectionery jig at the centre beneath the probe.
The depth of penetration selected for the test is determined by the sample's height, with deeper levels suitable for thicker samples. Consistency in test conditions is crucial when comparing different samples.
When adjusting test parameters, begin by testing the hardest sample to establish the maximum testing range for subsequent samples. This approach guarantees that the force capacity encompasses the range required for future samples.
Results
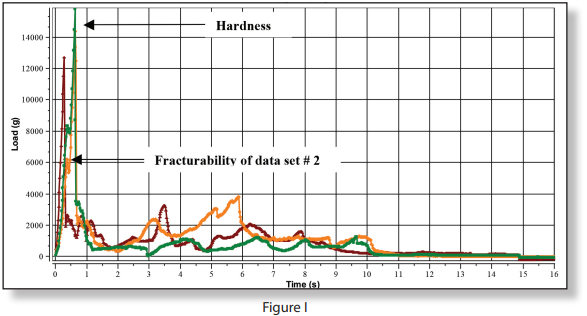
Figure I, the graph illustrates the relationship between load and time for assessing the hardness of candy using a confectionery jig and a 2mm cylinder probe. The peak force recorded serves as a measure of candy hardness, reflecting the force needed to bite into the hard candy. The fracturability value indicates the force necessary to initiate the first fracture, offering insight into the candy's brittleness; a higher value suggests lower brittleness. The variations in the graph signify the fractures occurring during the test, from which the quantity of fractures is derived to determine the candy's crunchiness.
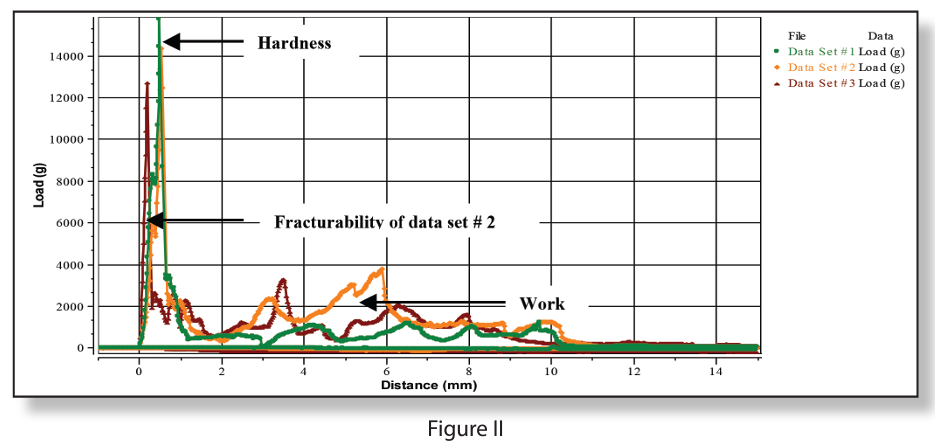
In Figure II, the graph illustrates the relationship between load and distance, depicting the effort needed to penetrate the candy. This graph not only indicates the hardness and fracturability of the candy but also represents the energy necessary to deform the candy with the molars. The work done is quantified by the area under the graph.
Observations
Once a trigger force of 15g is reached at the surface of the candy, the probe initiates compression and deformation of the candy across a specified distance (e.g., 15mm in this case). As the probe deforms the sample, the force/load is reflected in the sharp increase observed on the graphs. The maximum force indicated on the graph (Figure I and II) determines the hardness of the candy, which corresponds to the force needed to bite into the candy with the molars.
The work done, represented by the area under the load/distance graph (Figure II), reflects the energy needed to surpass the strength of the internal bonds in the candy during deformation. The number of fractures produced during the test (refer to Figures I and II) provides insight into the crunchiness of the sample; a higher value indicates a crunchier texture.
The texture analysis of candy's breaking attributes, including hardness, fracturability, and crunchiness, offers valuable insights during the product development phase. This information aids in optimising candy texture, product formulation, cooking durations, moisture levels, and confirming the desired sensory appeal of the product.
The table below summarises the average results taken from 12 samples:
| # | Sample Description Product Name |
Hardness (g) | Work Done (mJ) | Quantity of Fractures |
|---|---|---|---|---|
| 1 | Candy | 14068 ± 1051 | 156.8 ± 42.3 | 17 ± 4 |
|
To find out more: |