Viscosity FAQ
All your burning questions about Viscosity Answered.
For more information, please select a topic from the list below.
- What Is Viscosity?
- What Is The Science Of Viscosity?
- Newtonian Fluids
- Non-Newtonian Fluids
- Thixotropy and Rheopexy
- Laminar and Turbulent Flow
- What Affects The Rheological Property?
- Why Make Rheoligcal Measurements?
- Thinking Rheologically
- How Do I Choose A Spindle?
- How Do I Know If My Instrument Is Within Factory Specification?
- What Is The Best Calibration Check That I Can Perform?
- Should I Use A Digital Viscometer Or A Dial Reading (Analog) Viscometer?
- How Is Viscosity Affected By Temperature?
- What Is The Accuracy Of My Temperature Probe?
- How Long Should I Wait For Thermal Equilibrium?
- How Do I Calculate Accuracy Of The Reading When Testing A Sample?
- How Do I Calculate Cap 1000/2000 Accuracy?
- My Dial Reading And/Or CP (Viscosity) Value Won't Stabilise - What Does That Mean?
- My Spindle Wobbles When It Rotates - What Does That Mean?
- What Is A Math Model And When Should You Use It To Evaluate Viscosity Test Data?
- My Digital Viscometer Is Displaying "EEEEE" When I Am Trying To Test A Material. What Does That Mean?
- What Format Is Best To Save Data?
- Can PG Flash Be Used With My Computer?
- Where Can I See A Full Range Of Viscometers?
What Is Viscosity?
Viscosity is a principal parameter when any flow measurements of fluids, such as liquids, semi-solids, gases and even solids are made. Viscosity measurements are made in conjunction with product quality and efficiency. Anyone involved with flow characterisation, in research or development, quality control or fluid transfer, at one time or another gets involved with some type of viscosity measurement.
Many manufacturers now regard viscometers as a crucial part of their research, development, and process control programs. They know that viscosity measurements are often the quickest, most accurate and most reliable way to analyse some of the most important factors affecting product performance.
Rheological relationships help us to understand the fluids we are working with so that we can either know how they are behaving or force them to behave according to our needs.
There are many different techniques for measuring viscosity, each suitable to specific circumstances and materials. The selection of the right viscometer from the scores of instruments available to meet the need of any application is a difficult proposition. Today's instruments vary from the simple to the complex: from counting the seconds for a liquid to drain off a stick to very sophisticated automatic recording and controlling equipment. This places the instrument user in a position in which his own appreciation of the flow phenomena involved, coupled with the instrument manufacturer's "know how and experience", must be brought to bear.
What Is The Science Of Viscosity?
Viscosity is the measure of the internal friction of a fluid. This friction becomes apparent when a layer of fluid is made to move in relation to another layer. The greater the friction, the greater the amount of force required to cause this movement, which is called shear. Shearing occurs whenever the fluid is physically moved or distributed, as in pouring, spreading, spraying, mixing, etc. Highly viscous fluids, therefore, require more force to move than less viscous materials.
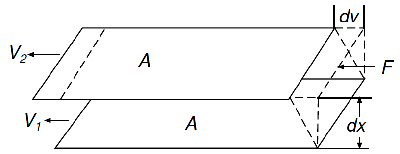
Isaac Newton defined viscosity by considering the model represented in the figure above. Two parallel planes of fluid of equal area A are separated by a distance dx and are moving in the same direction at different velocities V1 and V2. Newton assumed that the force required to maintain this difference in speed was proportional to the difference in speed through the liquid, or the velocity gradient. To express this, Newton wrote:

The velocity gradient, dv/dx , is a measure of the change in speed at which the intermediate layers move with respect to each other. It describes the shearing the liquid experiences and is thus called shear rate. This will be symbolized as S in subsequent discussions. Its unit of measure is called the reciprocal second (sec-1).
The term F/A indicates the force per unit arearequired to produce the shearing action. It is referred to as shear stress and will be symbolized by F'. Its unit of measurement is dynes per square centimeter (dynes/cm2).
Using these simplified terms, viscosity may be defined mathematically by this formula:

The fundamental unit of viscosity measurement is the poise. A material requiring a shear stress of one dyne per square centimeter to produce a shear rate of one reciprocal second has a viscosity of one poise, or 100 centipoise. You will encounter viscosity measurements expressed in Pascal-seconds (Pa-s) or milli-Pascal-seconds (mPa-s); these are units of the International System and are sometimes used in preference to the Metric designations. One Pascal-second is equal to ten poise; one milli-Pascal-second is equal to one centipoise.
Newton assumed that all materials have, at a given temperature, a viscosity that is independent of the shear rate. In other words, twice the force would move the fluid twice as fast.
Newtonian Fluids
This type of flow behaviour Newton assumed for all fluids is called, not surprisingly, Newtonian. It is, however, only one of several types of flow behaviour you may encounter. A Newtonian fluid is represented graphically in the figure below. Graph A shows that the relationship between shear stress (F′) and shear rate (S) is a straight line. Graph B shows that the fluid's viscosity remains constant as the shear rate is varied. Typical Newtonian fluids include water and thin motor oils.
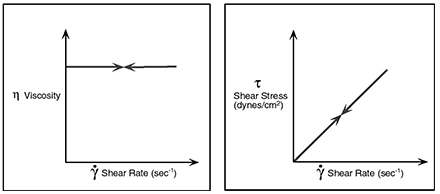
What this means in practice is that at a given temperature the viscosity of a Newtonian fluid will remain constant regardless of which Viscometer model, spindle or speed you use to measure it. Brookfield Viscosity Standards are Newtonian within the range of shear rates generated by Brookfield equipment; that's why they are usable with all our Viscometer models. Newtonians are obviously the easiest fluids to measure - just grab your Viscometer and go to it. They are not, unfortunately, as common as that much more complex group of fluids, the non-Newtonians, which will be discussed in the next section.
Non-Newtonian Fluids
A non-Newtonian fluid is broadly defined as one for which the relationship F′/S is not a constant. In other words, when the shear rate is varied, the shear stress doesn't vary in the same proportion (or even necessarily in the same direction). The viscosity of such fluids will therefore change as the shear rate is varied. Thus, the experimental parameters of Viscometer model, spindle and speed all influence the measured viscosity of a non-Newtonian fluid. This measured viscosity is called the apparent viscosity of the fluid and is accurate only when explicit experimental parameters are furnished and adhered to.
Non-Newtonian flow can be envisioned by thinking of any fluid as a mixture of molecules with different shapes and sizes. As they pass by each other, as happens during flow, their size, shape, and cohesiveness will determine how much force is required to move them. At each specific rate of shear, the alignment may be different and force may be required to maintain motion.
There are several types of non-Newtonian flow behaviour, characterized by the way a fluid's viscosity changes in response to variations in shear rate. The most common types of non-Newtonian fluids you may encounter include:
Psuedoplastic
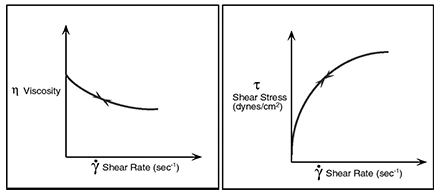
This type of fluid will display a decreasing viscosity with an increasing shear rate, as shown in the figure below. Probably the most common of the non-Newtonian fluids, pseudo-plastics include paints, emulsions, and dispersions of many types. This type of flow behaviour is sometimes called shear-thinning.
Dilatant
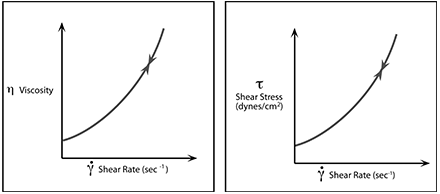
Increasing viscosity with an increase in shear rate characterizes the dilatant fluid; see the figure below. Although rarer than pseudoplasticity, dilatancy is frequently observed in fluids containing high levels of deflocculated solids, such as clay slurries, candy compounds, corn starch in water, and sand/water mixtures. Dilatancy is also referred to as shear-thickening flow behavior.
Plastic
This type of fluid will behave as a solid under static conditions. A certain amount of force must be applied to the fluid before any flow is induced; this force is called the yield value. Tomato catsup is a good example of this type fluid; its yield value will often make it refuse to pour from the bottle until the bottle is shaken or struck, allowing the catsup to gush freely. Once the yield value is exceeded and flow begins, plastic fluids may display Newtonian, pseudoplastic, or dilatant flow characteristics. See the figure below.
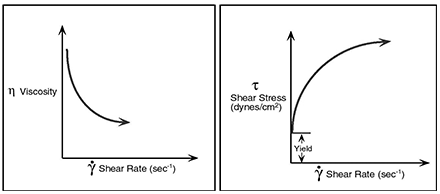
So far we have only discussed the effect of shear rate on non-Newtonian fluids. What happens when the element of time is considered? This question leads us to the examination of two more types of non-Newtonian flow: thixotropic and rheopectic.
Thixotropy And Rheopexy
Some fluids will display a change in viscosity with time under conditions of constant shear rate. There are two categories to consider:
Thixotropy
As shown in the figure below, a thixotropic fluid undergoes a decrease in viscosity with time, while it is subjected to constant shearing.
Rheopexy
This is essentially the opposite of thixotropic behaviour, in that the fluid's viscosity increases with time as it is sheared at a constant rate. See the figure below.
Both thixotropy and rheopexy may occur in combination with any of the previously discussed flow behaviors, or only at certain shear rates. The time element is extremely variable; under conditions of constant shear, some fluids will reach their final viscosity value in a few seconds, while others may take up to several days.
Rheopectic fluids are rarely encountered. Thixotropy, however, is frequently observed in materials such as greases, heavy printing inks, and paints.
When subjected to varying rates of shear, a thixotropic fluid will react as illustrated in the figure below. A plot of shear stress versus shear rate was made as the shear rate was increased to a certain value, then immediately decreased to the starting point. Note that the up and down curves do not coincide. This hysteresis loop is caused by the decrease in the fluid's viscosity with increasing time of shearing. Such effects may or may not be reversible; some thixotropic fluids, if allowed to stand undisturbed for a while, will regain their initial viscosity, while others never will.
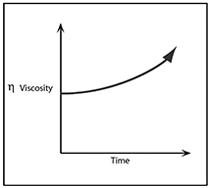
The rheological behavior of a fluid can, of course, have a profound effect on viscosity measurement technique. Later we will discuss some of these effects and ways of dealing with them.
Laminar and Turbulent Flow
The very definition of viscosity implies the existence of what is called laminar flow: the movement of one layer of fluid past another with no transfer of matter from one to the other. Viscosity is the friction between these layers.
Depending on a number of factors, there is a certain maximum speed at which one layer of fluid can move with relation to another, beyond which an actual transfer of mass occurs. This is called turbulence. Molecules or larger particles jump from one layer to another and dissipate a substantial amount of energy in the process. The net result is that a larger energy input is required to maintain this turbulent flow than a laminar flow at the same velocity.
The increased energy input is manifested as an apparently greater shear stress than would be observed under laminar flow conditions at the same shear rate. This results in an erroneously high viscosity reading.
The point at which laminar flow evolves into turbulent flow depends on other factors besides the velocity at which the layers move. A material's viscosity and specific gravity as well as the geometry of the Viscometer spindle and sample container all influence the point at which this transition occurs.
Care should be taken to distinguish between turbulent flow conditions and dilatant flow behavior. In general, dilatant materials will show a steadily increasing viscosity with increasing shear rate; turbulent flow is characterized by a relatively sudden and substantial increase in viscosity above a certain shear rate. The material's flow behavior may be Newtonian or non-Newtonian below this point.
Due to the relatively low shear rates at which most Brookfield Viscometers operate, it is unlikely that you will encounter turbulent flow unless you are measuring viscosities lower than 15 cP with an LV series Viscometer or 85 cP with other models. The higher the viscosity of a fluid, the less likely it is to experience turbulence. If turbulence is observed while measuring low viscosity fluids, it can often be eliminated by using the UL Adapter™ accessory.
What Affects The Rheological Property?
Viscosity data often functions as a "window" through which other characteristics of a material may be observed. Viscosity is more easily measured than some of the properties that affect it, making it a valuable tool for material characterisation. Having identified a particular rheological behavior in a material, you may wonder what this information implies about its other characteristics.
Temperature
One of the most obvious factors that can have an effect on the rheological behavior of a material is temperature. Some materials are quite sensitive to temperature, and a relatively small variation will result in a significant change in viscosity. Others are relatively insensitive. Consideration of the effect of temperature on viscosity is essential in the evaluation of materials that will be subjected to temperature variations in use or processing, such as motor oils, greases, and hot-melt adhesives.
Shear Rate
An appreciation of the effects of shear rate on materials is a necessity for anyone engaged in the practical application of rheological data. It would, for example, be disastrous to try to pump a dilatant fluid through a system, only to have it go solid inside the pump, bringing the whole process to an abrupt halt. While this is an extreme example, the importance of shear rate effects should not be underestimated.
When a material is to be subjected to a variety of shear rates in processing or use, it is essential to know its viscosity at the projected shear rates. If these are not known, an estimate should be made. Viscosity measurements should then be made at shear rates as close as possible to the estimated values.
It is frequently impossible to approximate projected shear rate values during measurement due to these values falling outside the shear rate range of the Viscometer. In this case, it is necessary to make measurements at several shear rates and extrapolate the data to the projected values. This is not the most accurate method for acquiring this information, but it is often the only alternative available, especially when the projected shear rates are very high. In fact, it is always advisable to make viscosity measurements at several shear rates to detect rheological behavior that may have an effect on processing or use. Where shear rate values are unknown or not important, a sample plot of viscosity versus RPM will often suffice.
Examples of materials that are subjected to, and are affected by, wide variations in shear rate during processing and use are: paints, cosmetics, liquid latex, coatings, certain food products, and blood in the human circulatory system.
Why Make Rheological Measurements?
Anyone beginning the process of learning to think Rheo-Logically must first ask the question, "Why should I make a viscosity measurement?" The answer lies in the experiences of thousands of people who have made such measurements, showing that much useful behavioral and predictive information for various products can be obtained, as well as knowledge of the effects of processing, formulation changes, aging phenomena, etc.
A frequent reason for the measurement of rheological properties can be found in quality control, where raw materials must be consistent from batch to batch. For this purpose, flow behaviour is an indirect measure of product consistency and quality.
Another reason for making flow behaviour studies is that a direct assessment of processability can be obtained. For example, a high viscosity liquid requires more power to pump than a low viscosity one. Knowing its rheological behaviour, therefore, is useful when designing pumping and piping systems.
It has been suggested that rheology is the most sensitive method for material characterization because flow behaviour is responsive to properties such as molecular weight and molecular weight distribution. This relationship is useful in polymer synthesis, for example, because it allows relative differences to be seen without making molecular weight measurements. Rheological measurements are also useful in following the course of a chemical reaction. Such measurements can be employed as a quality check during production or to monitor and/or control a process. Rheological measurements allow the study of chemical, mechanical, and thermal treatments, the effects of additives, or the course of a curing reaction. They are also a way to predict and control a host of product properties, end use performance and material behaviour.
Thinking Rheo-logically
To begin, consider the question, "Can some rheological parameter be employed to correlate with an aspect of the product or process?" To determine this, an instinct must be developed for the kinds of chemical and physical phenomena which affect the rheological response. For the moment, assume this information is known and several possibilities have been identified. The next step is to gather preliminary rheological data to determine what type of flow behaviour is characteristic of the system under consideration. At the most basic level, this involves making measurements with whichever Brookfield Viscometer is available and drawing some conclusions based on the descriptions of flow behaviour that follow.
Once the type of flow behaviour has been identified, more can be understood about the way components of the system interact. The data thus obtained may then be fitted to one of the mathematical models which have been successfully used with Brookfield instruments.
Such mathematical models range from the very simple to the very complex. Some of them merely involve the plotting of data on graph paper; others require calculating the ratio of two numbers. Some are quite sophisticated and require use of programmable calculators or computers. This kind of analysis is the best way for getting the most from our data and often results in one of two constants which summarize the data and can be related to product or process performance.
Once a correlation has been developed between rheological data and product behaviour, the procedure can then be reversed and rheological data may be used to predict performance and behaviour.
How Do I Choose A Spindle?
Selecting a Spindle:
The process of choosing a spindle and rotational speed for use with your viscometer is ultimately one of trial and error. However, there are several means to narrowing the possibilities before any testing is performed. If a sample has historically been tested using a particular speed and spindle combination, the user should use that same combination. This will help to ensure test results are accurate and repeatable. The objective is to choose a spindle that will produce a dial or digital display reading between 10% and 100% torque.
When the viscosity of a fluid is known:
The maximum viscosity range of a spindle running at a given speed is equal to the spindle factor multiplied by 100. This is the full scale range for that spindle/speed combination. The minimum viscosity that can be measured is equal to 10 times the factor, or one tenth of the full scale range. Knowing the full scale range, you can then determine if your fluid fits within the capabilities of that spindle/speed combination.
Additionally, digital viscometers equipped with the AUTO RANGE key allow the full scale range to be obtained automatically. Enter a spindle code and an RPM setting and press the AUTO RANGE key. The viscometer will calculate and display the full scale range viscosity for that spindle and speed combination.
When the viscosity of a fluid is not known.
If the reading is below 10% or above 100%, the user should choose a different speed to obtain a reading in the recommended range. If changing speeds doesn't provide readings between 10% and 100%, the user should try another spindle. Generally, if the reading is above 100% at the lowest speed, the next smallest spindle should be used. If the reading is below 10% at the highest speed, the next largest spindle should be used.
To test a fluid at multiple speeds, choose a spindle that will produce readings between 10% and 100% for at least three speed settings.
How Do I Know If My Instrument Is Within Factory Specification?
With the Brookfield range of Viscometers and Rheometers, the equipment is guaranteed to be accurate to +/- 1.0% of full scale range in use. You can check the accuracy of your Viscometer by performing a calibration check.
Calibration check for Viscometers/Rheometers using standard spindles:
You must use:
- 600 ml beaker; allow any air bubble to surface
- controlled temperature 25.0°C (+/- .01°C); allow sufficient time for temperature equilibrium; this includes standards, spindle and guard leg
- guard leg in place for LV and RV spindles
- fluid that has been initially opened within in past 12 months
- Accuracy for the calibration check is:
- Instrument Accuracy is 1% of Full Scale range in use (FSR) and is added to Standard Fluid Accuracy which is 1% fluid value in cP.
Calculating accuracy for the Instrument:
FSR is the factor for the spindle and speed in use multiplied by 100; FSR can also be found on digital models, by selecting a spindle, speed and then pressing the AUTO RANGE button; the screen will then display a cP value @ 100% (of FSR); 1% of that displayed FSR is instrument accuracy.
Determining Accuracy for the Standard Fluid:
Fluid value is on the label of the jar, above the word "value", and is stated in cP(mPa-s). Calculate 1% of this value.
Brookfield Ametek recommend Calibration by a Factory Trained Engineer on an Annual Basis or more frequently where instruments wear and tear might result in deviation form factory specification. Lab Unlimited Carl Stuart Group perform this Calibration with a Factory Calibrated Master Viscometer to tune your instrument to Factory Specification.
What Is The Best Calibration Check That I Can Perform?
Test your Viscometer/Rheometer with a Brookfield Viscosity Standard Fluid at 3 different rotational speeds to verify how the instrument responds when sensing low, medium, and high % torques.
Example:
RV Viscometer with RV #3 spindle at 20, 10, and 5 rpm
Brookfield Viscosity Standard Fluid: Nominal value = 5000 cP; Actual value = 4850 cP
Alternatively, if you predominately perform your test with a fixed Speed and Spindle choose 3 fluids at approximately 25%, 50% and 75% FSR to verify Instrument Performance.
Should I Use A Digital Viscometer Or A Dial Reading (Analog) Viscometer?
Viscosity results obtained from Brookfield instruments are reproducible regardless of whether an instrument is a dial reading or digital version. Assuming that all other conditions are identical - spindle, speed, temperature, container size, spring torque, etc., a reading produced on a dial reading viscometer is as valid, accurate, and reproducible as a reading produced on a digital viscometer.
How Is Viscosity Affected By Temperature?
Generally speaking, viscosity has an inverse relationship with temperature. As temperature increases, viscosity decreases. For this reason, it is critical to control the temperature of a sample during any viscosity measurement.
What Is The Accuracy Of My Temperature Probe?
Brookfield temperature accuracy is:
± 1 °C up to 150 °C
± 2 °C above 150 °C up to 300 °C
This accuracy applies for RTDs in DV-I+ w/Temperature Probe, DV-II+, Programmable DV-II+, DV-II+ PRO, DV-III, DV-III+, Thermosel w/Model 74,75, 85 and 106 Controllers, CP/CPE-44PY cups, SC4-**RPY Chambers.
How Long Should I Wait For Thermal Equilibrium?
Thermal equilibrium is the state at which every element of a viscosity measurement is at a unified temperature. These elements include, but are not limited to, the spindle, guard leg, sample container, sample, and temperature probe. Because temperature is critical to accurate readings, you should allow sufficient time to achieve equilibrium. In general, one hour is the minimum time to wait. The more viscous the material being measured, the longer you should wait.
Recommendations for silicones in 600 mL beakers
5 - 500 cP = 1 hour
1000 - 12,500 cP = 2 hours
30,000 - 100,000 cP = 4 hours
Recommendations for silicones and mineral oils in accessories, Cone/Plate, CAP, SSA, and UL Adapters
10 - 20 minutes depending on volume
Recommendations for mineral oil for KU Viscometers
1 - 2 hours
How Do I Calculate Accuracy Of The Reading When Testing A Sample?
Accuracy is calculated as 1% of the full scale range (FSR) of the viscometer. FSR is defined as the highest achievable viscosity reading with a given spindle and speed. The easiest way to determine FSR is by pressing the AUTO RANGE button on your digital viscometer. Pressing this displays FSR for the spindle and speed entered. Taking 1% of this value gives you instrument accuracy. For dial viscometer users, multiplying your factor by 100 gives you FSR. Consequently, you can see that your factor is equal to your instrument accuracy.
For newer DV1M and touchscreen DV2T and DV3T Digital Viscometer, the FSR is calculated and displayed every time a Spindle or Speed is updated setting up the method.
How Do I Calculate Cap 1000/2000 Accuracy?
Accuracy of the Brookfield CAP viscometer is based on two separate factors. The first factor is the accuracy of the instrument and the second is the accuracy of the calibration fluid. The total accuracy is the instrument accuracy plus the fluid accuracy.
Instrument accuracy is determined by consulting Table 3.1 in the CAP viscometer manual. The operator must determine whether the instrument is a high or low temperature CAP, and whether it is a 1000 or 2000 model. Cross referencing that information with the cone-spindle number in use, they will determine a number on the chart. This number is the percent of the full scale range that must be considered as the instrument accuracy.
For example: A CAP 1000H with cone spindle 3 at 900 rpm.
The operator must first determine the full scale range of the CAP for these conditions. By pressing the RPM button, the display will show 100% = X, X being the value in Poise of the full scale range. Under these conditions, FSR is 8.333 Poise. From Table 3.1, the percent of FSR calculated for accuracy is 2 or 4%, depending on whether the calibration fluid is greater or less than 50% of FSR.
If our calibration fluid is 4 Poise, we would calculate accuracy as 2% of FSR, or 2% of 8.333. Instrument accuracy would thus be .1666, rounded to .17 Poise. The fluid accuracy is 1% of 4 Poise, or .04 Poise. Thus total accuracy is .04 + .17, or .21 Poise.
My Dial Reading And/Or CP (Viscosity) Value Won't Stabilise - What Does That Mean?
Most fluids demonstrate a "non-Newtonian" behavior that prevents them from ever displaying a constant centipoise value or dial reading. For more information on Newtonian and Non-Newtonian fluids, consult our free publication More Solutions to Sticky Problems.
My Spindle Wobbles When It Rotates - What Does That Mean?
The spindle may be bent; check the straightness against the dimensions in Appendix A of our publication of More Solutions To Sticky Problems (by Brookfield Ametek). The jewel bearing, pivot point and shaft may be worn or bent; perform the calibration check to determine if the viscometer is still performing within calibration. The viscometer is in need of service and recalibration.
Carl Stuart Ltd is the authorised repair and calibration house for Brookfield Ametek equipment in Ireland, visit our Service Portal for more information or to log a breakdown / calibration.
What Is A Math Model And When Should You Use It To Evaluate Viscosity Test Data?
Various math models were empirically developed by different researchers, in order to fit trends they saw in their own data sets. The Math Model is a "best fit" line that can be used to characterize data from a specific test and has the advantage for easy data storage and comparison with similar tests by looking at slope and y-intercept.
There are some simple models that provide a reasonable fit to many data sets, and have parameters that have some meaning to various practitioners - whether those people are researchers, QA/QC people, or process engineers. The modified Casson model, for example, works well for testing chocolates, among other things. The Herschel-Bulkley model is useful for materials that have a yield point and then "shear-thin" after yielding. This may be good for "gel-like" materials, for example.
Brookfield's "Analysis" module in our applications software (Rheocalc and Wingather) lists the curve-fit parameter results, along with a "Coefficient of Fit". One could try a few of our models, and select the one with the best "CoF", for example - the closer to "1.00", the better the fit. It may be tough to accurately predict product behavior. Conservatively used, rheology models may be good for interpolating apparent viscosities at various shear rates, for example. Nonetheless, some models may be used to extrapolate yield stresses, for example, at shear rate values of zero. The more data points taken, the more reliable the fit.
Please also bear in mind that a certain model may have been used just because it's "simple" and "good enough for a reasonable estimate". That does not mean that it would be the best model to use. One example is in the Petroleum industry: "drilling mud" rheology has been examined with the Bingham model for years, despite the fact that these materials are highly non-Newtonian! The Bingham model assumes Newtonian behavior after yield. Nonetheless, field personnel felt it is was "good enough" to give them an idea of how the material was handling. More practitioners have started using the "H-B" model during the past few years.
View our range of Brookfield Ametek Software in our webshop.
My Digital Viscometer Is Displaying "EEEEE" When I Am Trying To Test A Material. What Does That Mean?
A display of "EEEEE" on a digital viscometer means the reading is over-range. That is, for the spindle and speed you have selected, the material is reading higher than the Full Scale Range. Lower the speed or change the spindle to raise the Full Scale Range.
What Format Is Best To Save Data?
We recommend saving data in both the native form and as CSV files. CSV files can be read by both ASCII/Plain Text readers and Spreadsheet programs such as Microsoft Excel.
Can PG Flash Be Used With My Computer?
PG Flash is only for downloading programs to the viscometer. Rheocalc-T should be used for acquiring data to a PC when used with DV2T or DV3T.
View our range of Brookfield Ametek Software in our webshop.
Discover Viscosity, Texture & Powder with Lab Unlimited!
Discover more about viscosity, texture, and powder analysis with Lab Unlimited.
Contact our team for technical support, guidance, or to explore our full range of Brookfield AMETEK instruments and viscosity standards.
1 Your privacy is important to us and we are committed to protecting that privacy. By submitting this form you are consenting to Carl Stuart contacting you about our products and services that are relevant to you. You may unsubscribe from these communications at any time. For more information, check out our Privacy Policy.
